Obesity is a serious health issue affecting people worldwide. It can shorten life expectancy and increase the risk of many chronic diseases, such as heart disease, type 2 diabetes, cancer, liver disease, and breathing problems. Obesity can also affect mental health, adding another layer of difficulty for those living with this condition.
Obesity actually means having an abnormal or excessive amount of body fat that poses a risk to health. A body mass index (BMI) over 25 is classified as overweight, while a BMI over 30 is considered obese.
Obesity isn’t just a problem for wealthy countries anymore. WHO reports that it’s part of a global issue of malnutrition, where more people are now overweight than underweight in most parts of the world, except in Southeast Asia. Shockingly, some middle-income countries are now seeing the highest rates of obesity.
This issue hits close to home for many of us. It’s not just about numbers and statistics; it’s about real people facing real struggles every day. Understanding obesity statistics and facts is crucial for improving our collective health and ensuring a brighter future for everyone. So let’s have a look:
How People Become Obese?
Overweight and obesity happen when you eat more calories than you use. This energy imbalance occurs when the calories you take in (from food) are more than the calories you burn (through activities like breathing, digestion, and exercise).
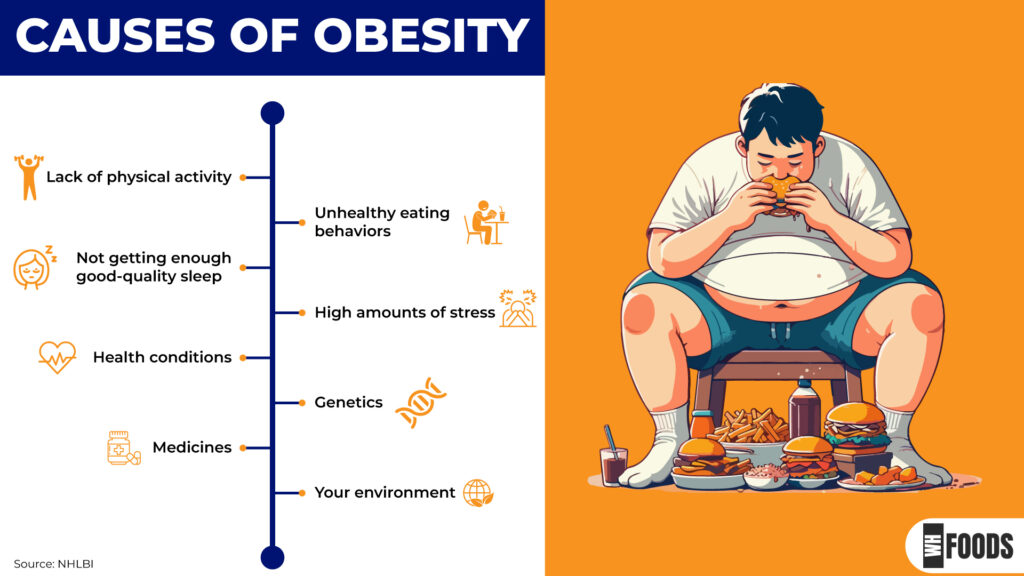
An energy imbalance makes your body store more fat than it can use. However, your risk of becoming overweight or obese isn’t just about how much you eat. Other factors, such as genetics, physical activity levels, and environment, also play a role.
- There are many risk factors for overweight and obesity. Some are personal factors like your knowledge, skills, and behaviors. Others come from your environment, such as your school, workplace, and neighborhood. Additionally, food industry practices and marketing, as well as social and cultural norms and values, can also affect your risk. (1)
What Percentage of Americans Are Obese?

BMI is a tool used to estimate and screen for overweight and obesity in both adults and children. It is calculated by dividing a person’s weight in kilograms by their height in meters square. BMI is closely related to the amount of body fat, and having a high BMI can increase the risk of many health problems. A healthcare professional can assess whether a person’s weight poses a risk to their health.
- Based on data from Trust for America’s Health collected between 2017 and 2020, 41.9% of adults in the U.S. have obesity. This statistic highlights the growing concern over obesity rates in the country and underscores the need for effective public health interventions. (2)
- The same data suggests that the national youth obesity rate was 19.7% from 2017 to 2020. As with adults, obesity has been rising among children for decades, reflecting a significant public health challenge. (2)
- Estimates from the 2017–2018 National Health and Nutrition Examination Survey (NHANES) showed that about 42.5% of U.S. adults aged 20 and over are obese, with 9.0% experiencing severe obesity. Additionally, another 31.1% of adults are classified as overweight. (3)
- Between the 1999-2000 and 2017-2020 surveys, the obesity rate in the U.S. increased significantly. Among adults aged 20 and older, it rose by 37%, and among youth aged 2 to 19, it increased by 42%. (2)
- In the U.S., obesity is associated with 30-53% of new diabetes cases each year. Obesity has been a major driver of diabetes for the last two decades. (4)
- Compared to those with a normal weight, obesity increases job absenteeism due to injury or illness by 3.0 days per year. Absenteeism increased with the severity of obesity, leading to up to seven additional days missed per year in the most severe cases. (5)
Global Obesity Statistics

Many low and middle income countries are dealing with a double burden of malnutrition. While they continue to struggle with infectious diseases and undernutrition, they are also facing a rapid increase in noncommunicable disease risk factors like obesity and overweight. It is not uncommon to find undernutrition and obesity existing side by side within the same country, community, and even household.
- According to the World Health Organization, over 1 billion people globally are obese, including 650 million adults, 340 million adolescents, and 39 million children. (6)
- The WHO estimates that 167 million people, adults and children, will face health declines due to obesity by 2025. (6)
- More than one in eight people worldwide is now obese. The global prevalence of obesity nearly tripled from 1975 to 2016, reaching 13%. (7)
- Globally, obesity is responsible for 4.72 million deaths each year. This accounts for roughly 8% of all global deaths, which is about the same number of people who die from air pollution. (7)
- The World Obesity Federation forecasts that by 2035, over 4 billion people worldwide may be affected by overweight and obesity, compared to over 2.6 billion in 2020. This represents an increase from 38% of the global population in 2020 to more than 50% by 2035. (8)
- The prevalence of obesity alone is expected to increase from 14% to 24% of the population between now and 2035, impacting nearly 2 billion adults, children, and adolescents. (8)
- The increase in obesity rates is expected to be most pronounced among children and adolescents. Between 2020 and 2035, obesity in boys is projected to rise from 10% to 20% and in girls from 8% to 18%. (8)
- According to the same study, if current trends continue, overweight and obesity are projected to cost the global economy over $4 trillion in potential income by 2035. This amount is nearly 3% of the current global gross domestic product (GDP). (8)
Obesity Breakdown by Age Groups, Gender, and Race
By Age (Children, Adolescents, Adults)
- Between 2017 and March 2020, the obesity prevalence among children and adolescents aged 2–19 years was 19.7%. This means approximately 14.7 million U.S. youths are obese. (9)
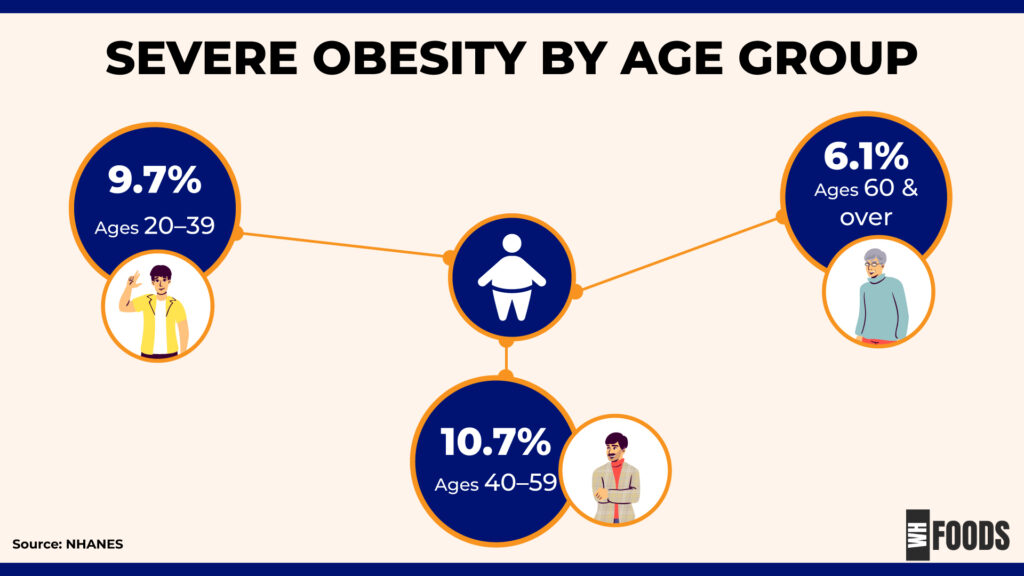
- The prevalence of severe obesity varies by age group, with the lowest rates among those aged 60 and over. Specifically, 9.7% of adults aged 20–39, 10.7% of adults aged 40–59, and 6.1% of adults aged 60 and over are affected by severe obesity. (9)
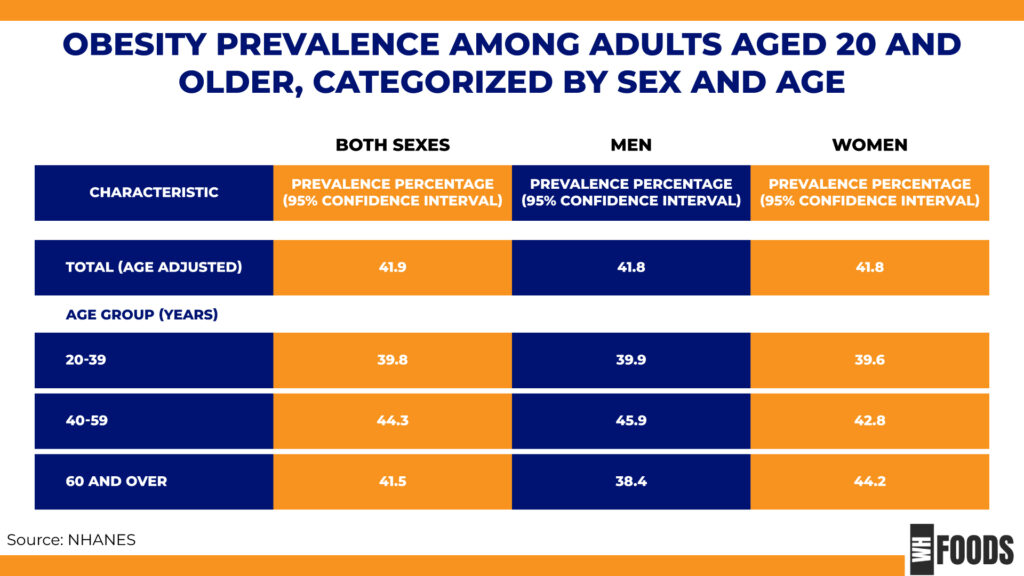
- Among adults aged 20 and older, the age-adjusted prevalence of obesity was 41.9%, with severe obesity at 9.2%. (9)
- Among adults aged 20–39, the age-adjusted prevalence of obesity is 39.8%, while for those aged 40–59, it is 44.3%. (9)
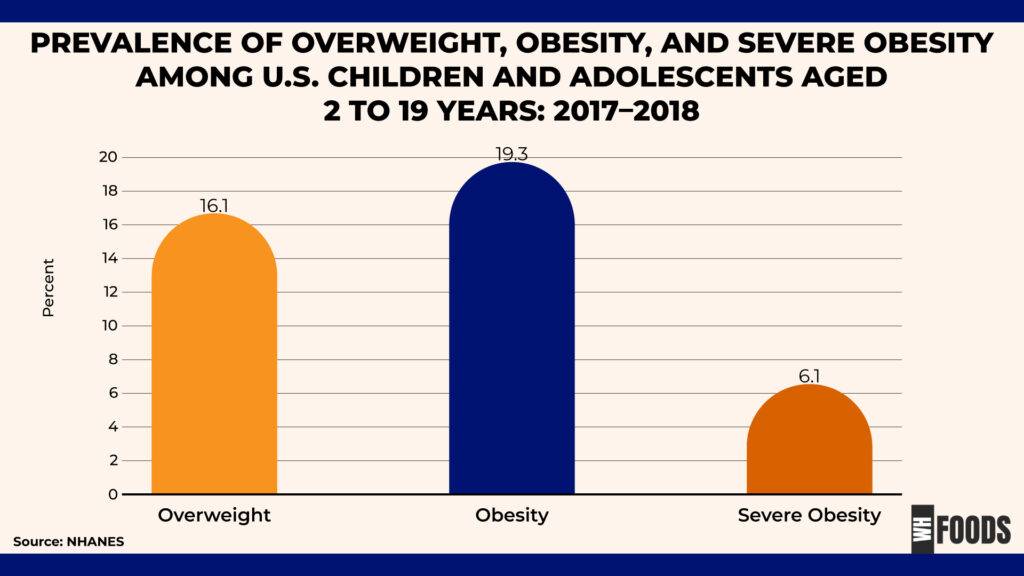
- An estimated 19.3% of U.S. children and adolescents aged 2–19 have obesity, including 6.1% with severe obesity, and 16.1% are overweight. Childhood obesity is a big public health issue in the USA.
- It affects both the physical and mental health of children. Kids who are obese are more likely to grow up to be adults who are obese, continuing the cycle of health issues. (10)
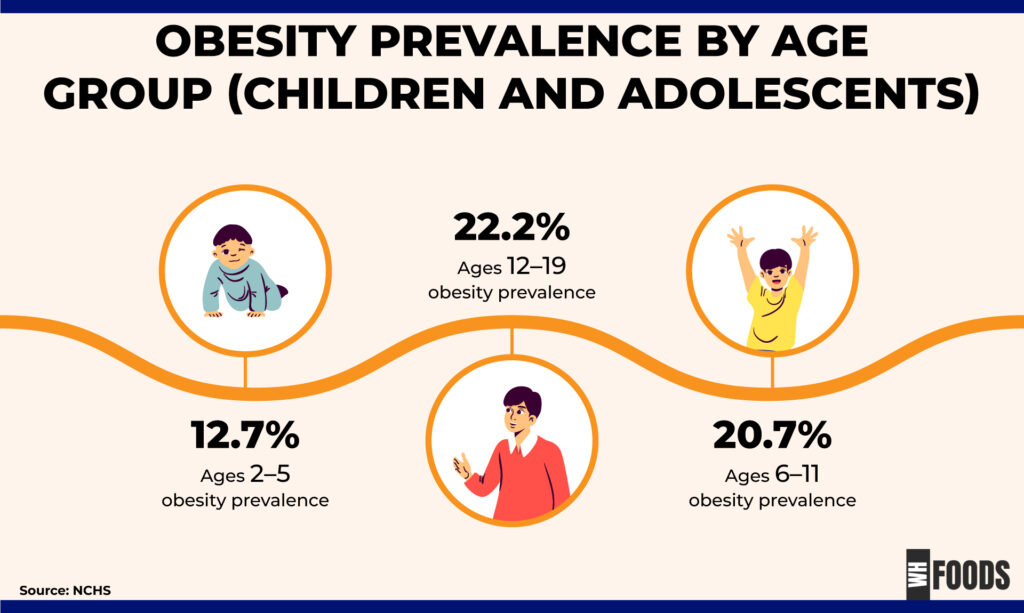
- The prevalence of obesity increases with age among U.S. children. From 2017 to March 2020, the obesity rates were 12.7% for children aged 2–5 years, 20.7% for those aged 6–11, and 22.2% for adolescents aged 12–19. (9)
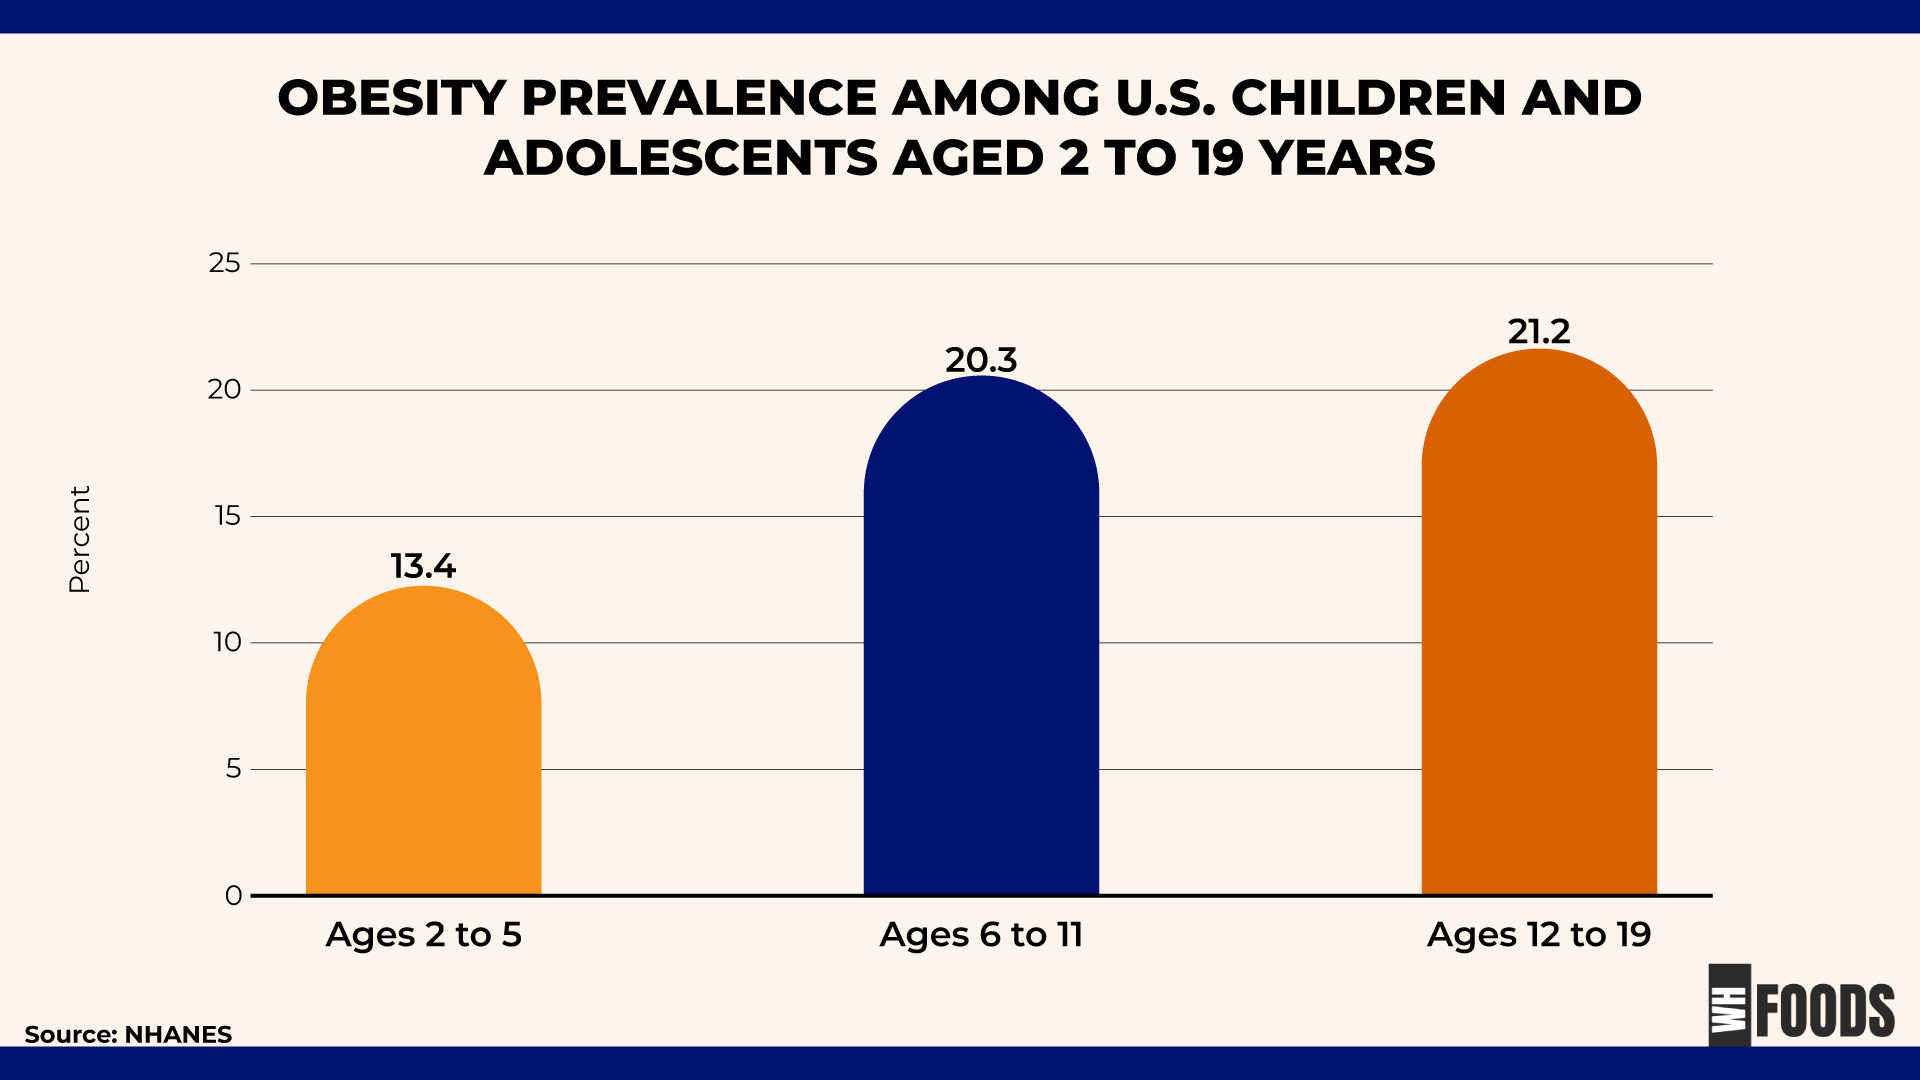
- Among children aged 2 to 5, 13.4% have obesity; among those aged 6 to 11, 20.3% have obesity; and among adolescents aged 12 to 19, 21.2% have obesity. Childhood obesity has long-term negative impacts on health and quality of life. The prevalence of obesity in children increased steadily from the early 1960s through the late 2010s and has now plateaued at an alarmingly high level. (10)
- The obesity prevalence among children and adolescents aged 2 to 19 years approximately doubled from 1988–1994 to 2017–2018. Being underweight and obesity are linked to negative health outcomes throughout a person’s life. Both conditions increase the risk of developing chronic diseases and can lead to diminished overall health and quality of life. (10)
By Race and Ethnicity
- Obesity was most prevalent among non-Hispanic black adults (49.9%), followed by Hispanic adults (45.6%), non-Hispanic white adults (41.4%), and non-Hispanic Asian adults (16.1%). Over the past two decades, obesity rates have increased across all population groups. However, populations of color, particularly Black and Hispanic communities, have experienced the highest rates. This disparity is often due to structural barriers, such as limited access to affordable healthy foods, fewer opportunities for physical activity, and inadequate healthcare resources. (9)
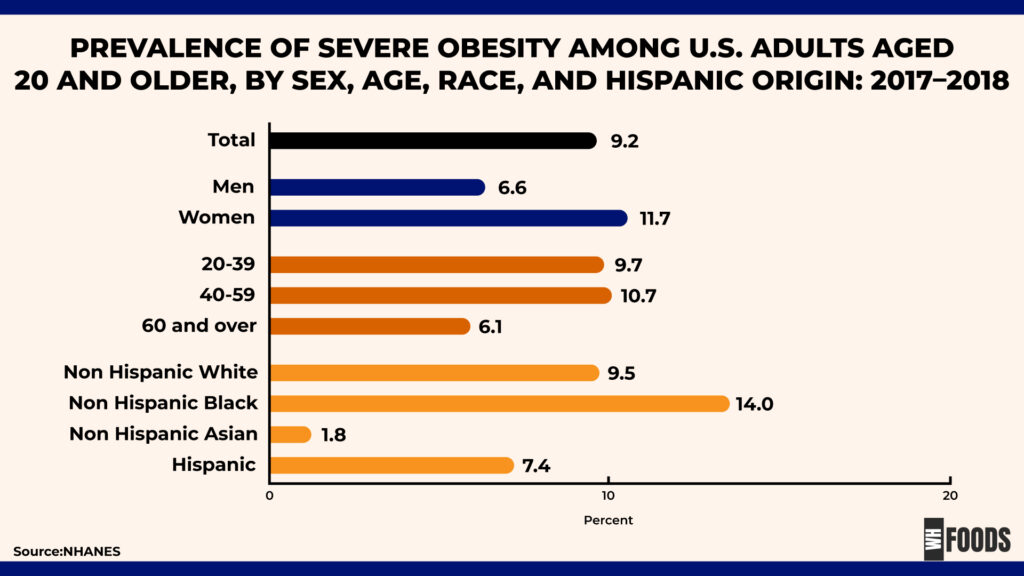
- Severe obesity rates were 14.0% for non-Hispanic Black adults, 9.5% for non-Hispanic White, 7.4% for Hispanic, and 1.8% for non-Hispanic Asian adults. Black and Hispanic people are more likely to face economic challenges, and these same groups also have higher rates of obesity. This suggests that income disparities can contribute to health disparities, as lower-income individuals often have limited access to healthy foods, safe places for physical activity, and healthcare resources. (9)
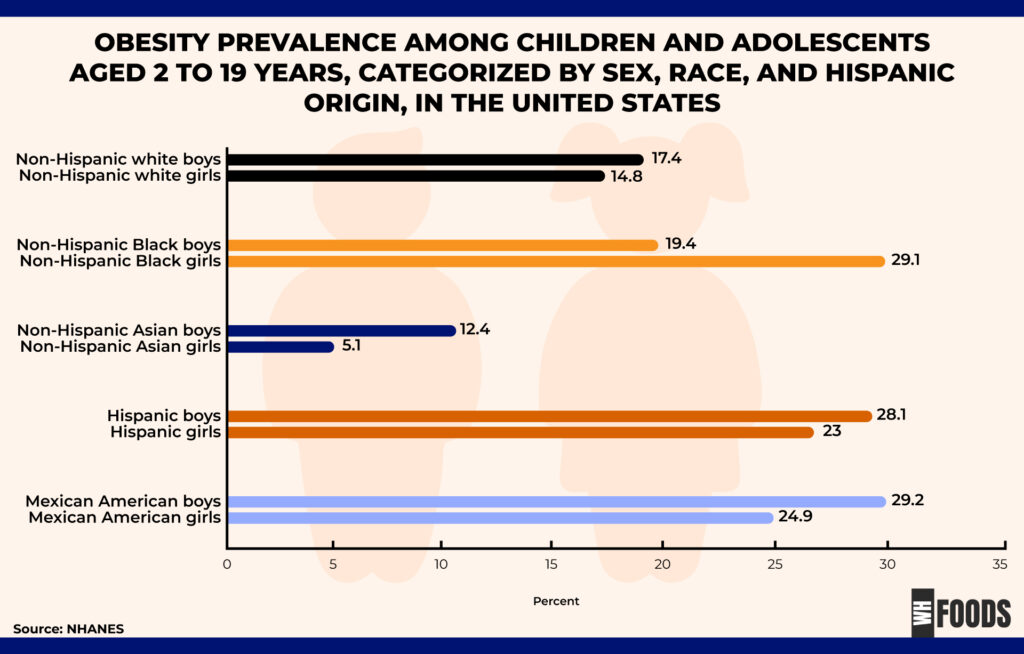
- Obesity affects 17.4% of non-Hispanic White boys and 14.8% of non-Hispanic White girls. Children whose parents have less education or come from low-income families are more likely to be in the obese trajectory group compared to their peers. (10)
- Non-Hispanic Black women have a higher prevalence of obesity compared to non-Hispanic Black men. Non-Hispanic Black boys have an obesity rate of 19.4%, while non-Hispanic Black girls have a rate of 29.1%. (10)
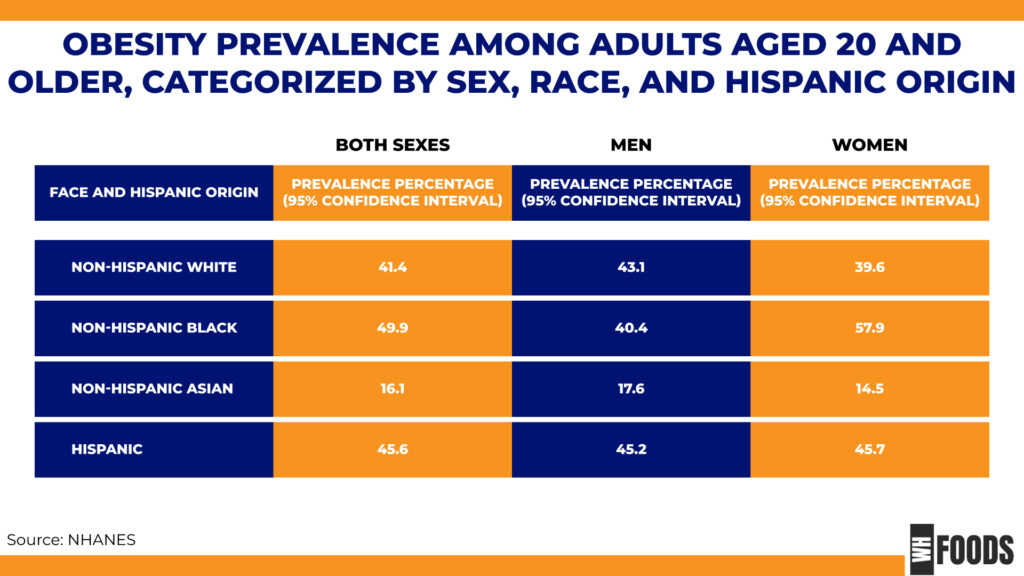
- Obesity rates are as follows: 43.1% for non-Hispanic White men, 40.4% for non-Hispanic Black men, 17.6% for non-Hispanic Asian men, and 45.2% for Hispanic men. Among adults, overall, the prevalence of both obesity and severe obesity is highest in non-Hispanic Black adults compared to other racial and Hispanic-origin groups. (9)
By Gender
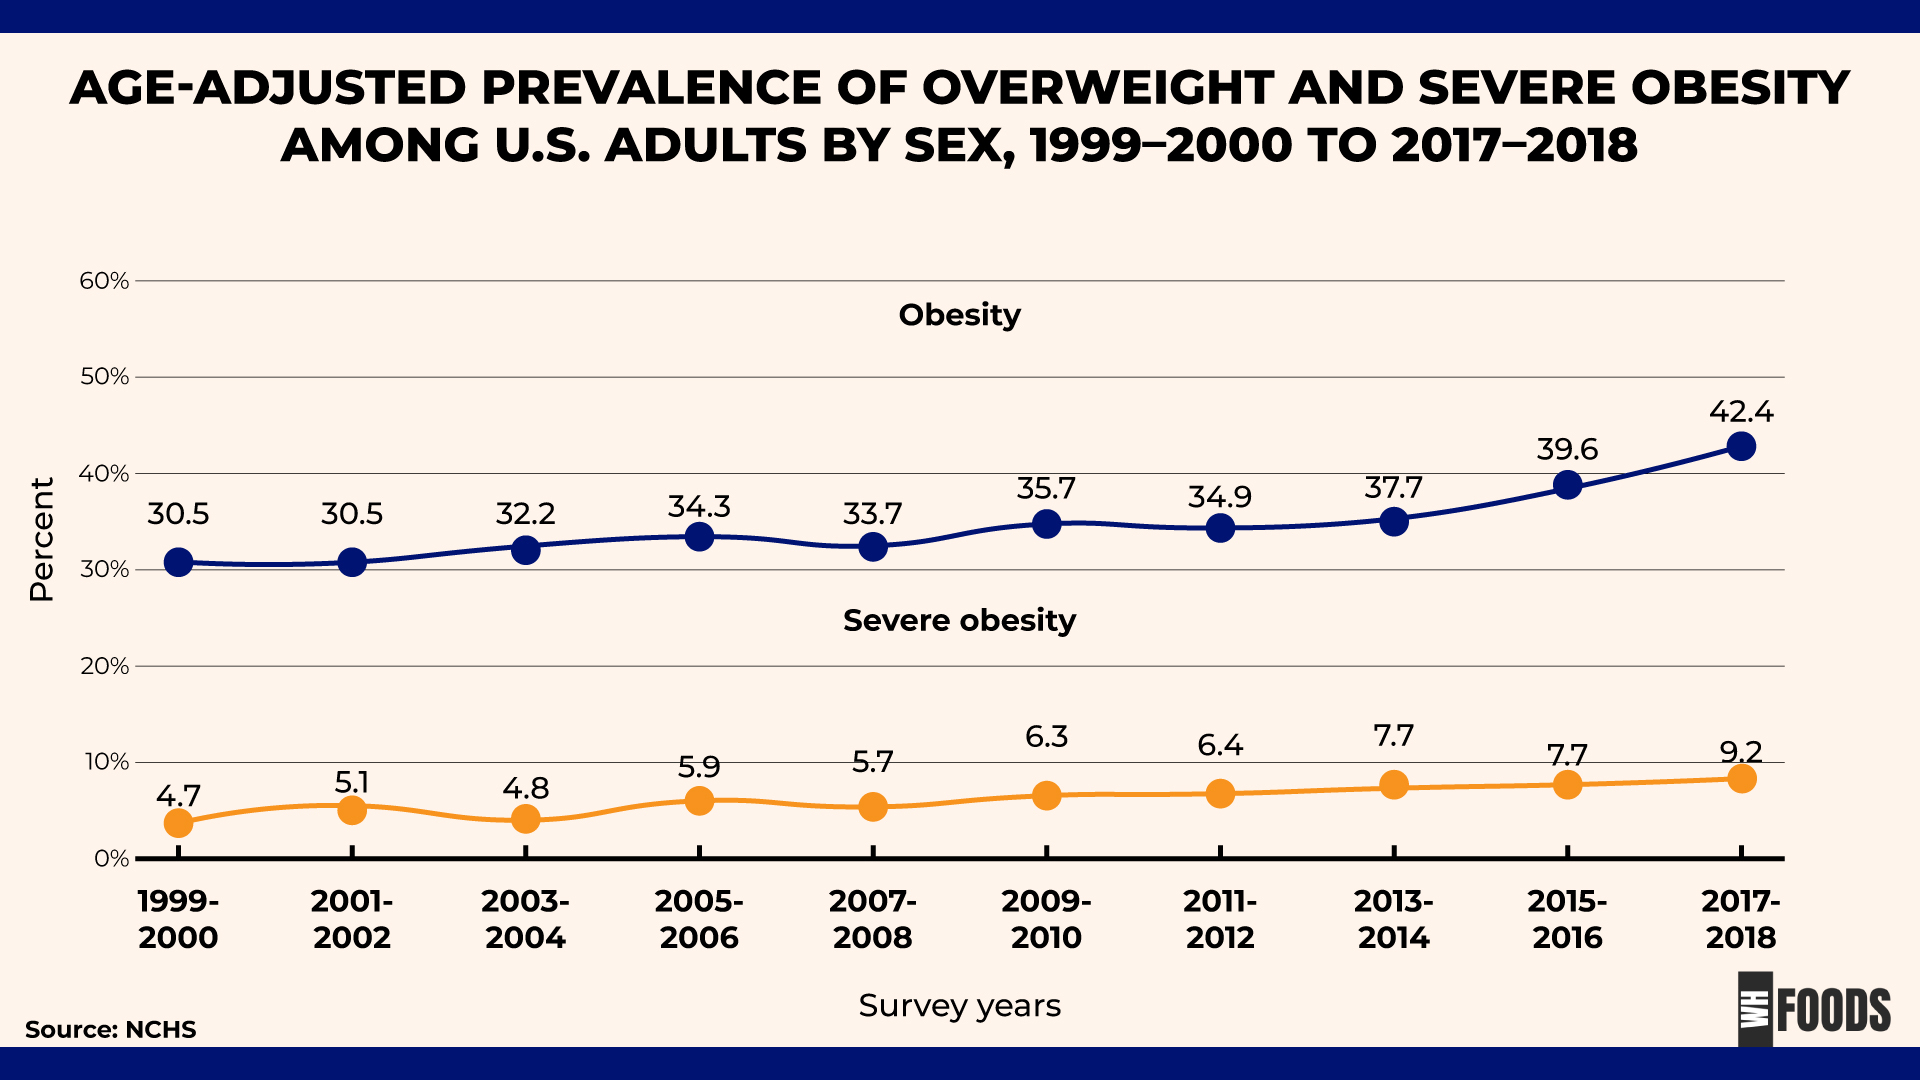
- The prevalence of obesity and severe obesity among adult men and women has significantly increased. From 1999–2000 through 2017–2018, the age-adjusted prevalence of obesity in the U.S. increased from 30.5% to 42.4%. During the same period, the prevalence of severe obesity nearly doubled, rising from 4.7% to 9.2%. (11)
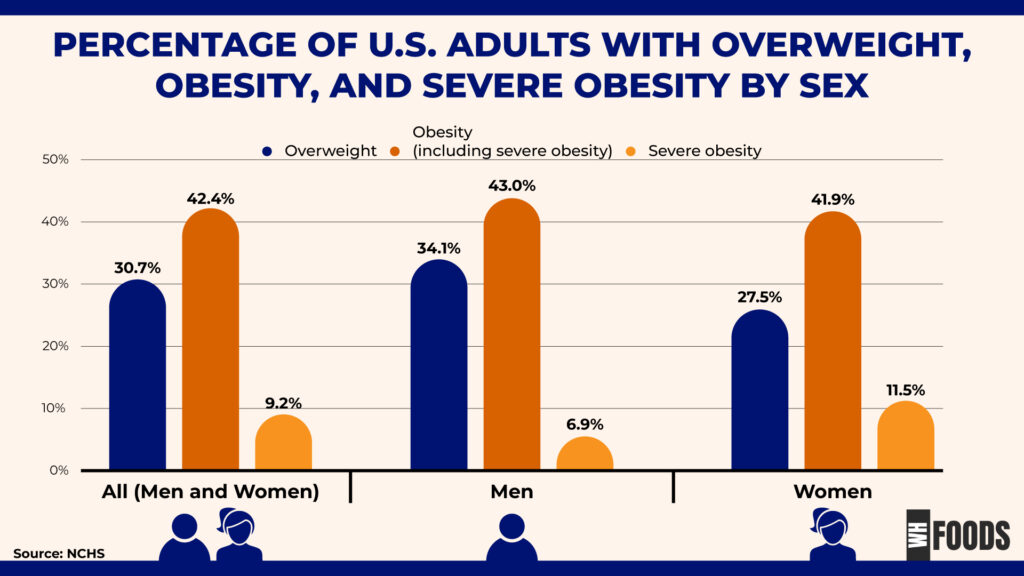
- Severe obesity affects a higher percentage of women (11.5%) compared to men (6.9%). The percentage of men who are overweight (34.1%) is higher than the percentage of women who are overweight (27.5%). This difference highlights gender-specific trends in weight management and underscores the importance of tailored approaches to address overweight and obesity in both men and women. (3)
Economic Costs of Obesity
In 2023, obesity and overweight are estimated to have cost US businesses and employees a staggering $425.5 billion. The costs associated with obesity reached $347.5 billion, while those related to being overweight amounted to $78 billion. (12)

- Obesity costs per 10,000 employees range from $19.4 million in professional services to $36.7 million in the government sector. (12)
Obesity and Overweight

- Obesity in children and adolescents aged 2–19 years is defined as having a BMI at or above the 95th percentile on growth charts for their age and sex, according to expert recommendations. Severe obesity is defined as a BMI at or above 120% of the 95th percentile. (10)
- Hypertension prevalence increased with weight: 31.1% in normal weight, 40.6% in overweight, and 57.7% in obese individuals. The prevalence of hypertension rises with age and increases further with higher weight status in both men and women. (9)
- For both men and women, the prevalence of diabetes rises with increasing weight status: 6.6% for normal weight, 10.3% for overweight, and 23.3% for obesity. Obesity can be linked to several serious health issues, including insulin resistance and cardiovascular disease. (9)
Adult Obesity Rates By States
- In 2022, adult obesity rates were at or above 35% in 22 states. Georgia, Virginia, and Wisconsin surpassed 35% for the first time, joining 19 other states. (2)
- Between 2021 and 2022, no states saw statistically significant changes, either increases or decreases, in their obesity rates. (2)
- In 2021, West Virginia had the highest obesity rate at 40.6%, while Colorado had the lowest at 25.1%. (2)
- Kentucky saw the highest increase in obesity rate, rising from 36.6% in 2020 to 40.3% in 2021. (2)
- Obesity rates are not worsening in every state. California experienced a significant decrease in its obesity rate, dropping from 30.3% in 2020 to 27.6% in 2021, marking the most substantial improvement among all states. (2)
Has Obesity Decreased in America?
The idea that the growth in average BMI in the U.S. is slowing may seem surprising amidst the ongoing obesity crisis and widespread advertisements for new weight-loss medications. However, this trend doesn’t imply there’s no cause for concern. In fact, more Americans than ever are now experiencing severe obesity, which presents significant health risks.
- According to the World Obesity Atlas 2023, it is projected that by 2035, 58% of adults in the USA will be living with obesity, categorizing the prevalence as very high. (8)
- The World Obesity Atlas 2023 also predicts a high annual increase in obesity rates in the USA from 2020 to 2035, with adult obesity rate expected to rise by 2.1% each year and childhood obesity by 2.4% each year. (8)
- Rural areas and counties have higher rates of obesity and severe obesity compared to urban areas. Minority racial groups and people living in rural areas are more likely to experience obesity due to societal and environmental factors. This includes limited access to healthy foods, fewer opportunities for physical activity, and socioeconomic challenges that contribute to higher rates of obesity in these populations. (2)
Final Thought
The latest obesity report highlights a staggering global burden of excess weight gain, particularly alarming in high-income countries like America. Childhood and adolescent obesity rates have soared, creating a generation at risk for serious health consequences such as cardiovascular diseases, high blood pressure, and certain cancers. This trend is not just confined to urban areas; rural communities are also grappling with the impact, straining the health care system.
To combat this crisis, we must prioritize healthy eating and physical activity across all age groups. Emphasizing a healthy diet with nutritious, energy-balanced foods can prevent excess weight gain and promote a healthy weight. By addressing the obesity increase through better health statistics and interventions from the Centers for Disease Control, we can mitigate the risk factors associated with obesity and improve America’s health and the well-being of communities worldwide.
Sources
- NHLBI: Overweight and Obesity – Causes and Risk Factors
- TFAH – The State of Obesity: BETTER POLICIES FOR A HEALTHIER AMERICA
- CDC – Prevalence of Overweight, Obesity, and Severe Obesity Among Adults Aged 20 and Over: United States, 1960–1962 Through 2017–2018
- Newsroom – Obesity contributes to up to half of new diabetes cases annually in the United States
- JOEM – Job Absenteeism Costs of Obesity in the United States: National and State-Level Estimates
- WHO: World Obesity Day 2022 – Accelerating action to stop obesity
- The World Counts: Statistics about obesity
- World Obesity Atlas 2023
- CDC: National Health and Nutrition Examination Survey 2017–March 2020 Prepandemic Data Files—Development of Files and Prevalence Estimates for Selected Health Outcomes
- CDC – Prevalence of Overweight, Obesity, and Severe Obesity Among Children and Adolescents Aged 2–19 Years: United States, 1963–1965 Through 2017–2018
- NCHS Data Brief – CDC: Prevalence of Obesity and Severe Obesity Among Adults: United States, 2017–2018
- US businesses and employees face staggering $425.5 billion in economic costs from obesity and overweight in 2023, reveals GlobalData


Write a comment
Your email address will not be published. All fields are required